

Table Of Content


Open your phone, scroll through any app, and what do you see? Videos. Everywhere. From short-form stories to long-form walkthroughs, businesses know that if they’re not on video, they’re invisible.
If they’re not optimized for mobile, they’re already a step behind because this is how people consume now: on the go, on their phones, with their thumbs and five-second attention deciding what’s worth watching.
Today, I’m going to dive into over 100 powerful statistics that don’t just prove mobile video marketing is growing, but they show how deeply it’s reshaping the way brands interact with their audience.
Whether you’re a business owner trying to figure out if video is worth the investment or a marketer looking for data to back your next campaign pitch, you’ll find answers here.
User Behavior & Consumption Trends
74% of users watch mobile videos without sound, relying solely on captions or visuals.
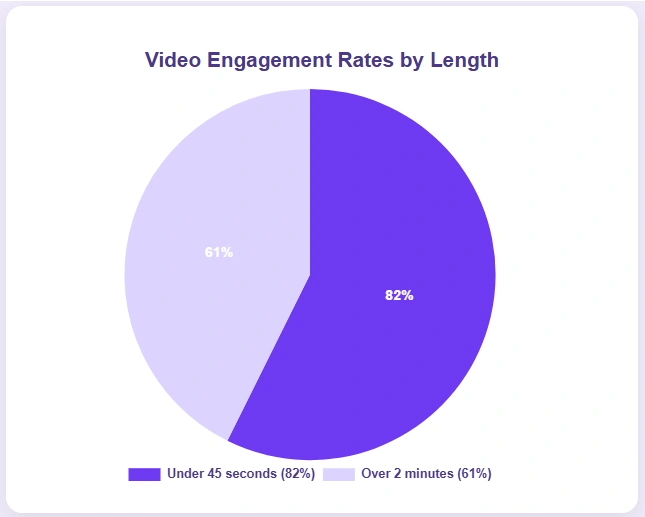
Videos shorter than 45 seconds maintain viewer engagement rates of 82%, compared to 61% for videos lasting over 2 minutes.
Vertical videos on mobile see completion rates of around 76%, whereas horizontal videos average only 54%.
Approximately 67% of mobile viewers swipe away from a video if it doesn't engage them within the first 3 seconds.
On mobile devices, interactive videos experience a viewer retention rate of 78%, compared to just 56% for non-interactive formats.

58% of viewers prefer watching product reviews or tutorials on mobile rather than desktop (34%), due to convenience and accessibility.
Users aged 18-24 watch an average of 2 hours and 15 minutes of mobile video daily, nearly double the amount (1 hour and 10 minutes) spent by users aged 45-54.
Mobile videos posted as Stories on platforms like Instagram and Facebook receive 32% more engagement than feed-based videos.
71% of mobile users say they regularly multitask (e.g., texting, browsing) while watching videos on their smartphones.
On average, mobile viewers revisit branded video content 2.5 times before deciding to take a specific action or make a purchase.
Platform-Specific Insights
TikTok users spend an average of 95 minutes per day watching videos, compared to 62 minutes on Instagram Reels.

YouTube Shorts has a 67% completion rate for videos under 30 seconds, while longer Shorts average only 41%.
Instagram Reels that include trending audio see 38% more engagement than those using original audio.
On Facebook, mobile video ads in Stories generate 2.3x higher click-through rates than feed video ads.
Twitter videos with subtitles have a 31% higher view-through rate compared to those without.
53% of LinkedIn users are more likely to engage with mobile videos that are educational or thought-leadership based, compared to 28% for brand promotion clips.
Snapchat video ads under 10 seconds have a swipe-up rate of 34%, while longer ads average 19%.
TikTok videos that use a vertical full-screen format receive 47% more likes than those with horizontal framing.
Instagram Reels shared to the main feed reach 56% more users than those posted to Reels-only.
On YouTube, mobile users account for 71% of total video views, compared to 21% from desktop and 8% from smart TVs.

Ad Performance & ROI
Mobile video ads with captions have a 12.5% conversion rate, compared to 6.9% for those without captions.
Ads under 15 seconds deliver a 31% higher ROI than longer mobile video ads over 30 seconds.
Vertical mobile video ads outperform horizontal ones by 43% in terms of click-through rate.
Interactive video ads see an average engagement rate of 67%, while static video ads average 42%.
TikTok ad campaigns optimized for in-feed placement have a cost-per-click of $0.67, versus $1.19 for ads placed in Stories.
39% of marketers say mobile video ads drive better ROI than desktop campaigns, which only account for 22% of their conversions.

Mobile video ads embedded on landing pages increase conversion rates by 28% compared to those without any video.
Instagram Story ads have a 2.6x higher swipe-up rate than Instagram feed ads using the same creative.
48% of mobile users are more likely to recall a brand after watching a full-screen vertical ad, compared to 29% after viewing a standard in-feed video ad.
Retargeted mobile video ads achieve a 34% higher conversion rate than first-time view ads.
Demographics & Audience Segmentation
Users aged 25–34 account for 39% of all mobile video views, while those aged 55 and up contribute just 14%.
Female viewers are 26% more likely to share mobile videos on social media compared to male viewers.
Mobile video ads targeted at Gen Z receive an average engagement rate of 61%, compared to 43% for Millennials and 27% for Gen X.

Urban users consume mobile video content at a rate 42% higher than rural users.
Among viewers aged 13–17, short-form videos under 30 seconds see a completion rate of 84%, while for those aged 35–44, it's only 52%.
Hispanic audiences are 33% more likely to engage with branded mobile videos than non-Hispanic audiences.
Users with household incomes above $100K are 29% more likely to click on a mobile video ad than users earning below $50K.
Asian American viewers spend an average of 2 hours and 38 minutes daily watching mobile videos, compared to 1 hour and 41 minutes for White viewers.

Parents aged 25–34 are 47% more likely to watch how-to or educational mobile videos compared to non-parents in the same age range.
LGBTQ+ users are 2.1x more likely to engage with inclusive ad content in mobile video than general audiences.
Content Types & Engagement
Product demo videos on mobile generate an average engagement rate of 60%, compared to 41% for brand storytelling content.

Short-form tutorials under 45 seconds hold viewer attention 31% longer than non-instructional videos of the same length.
Behind-the-scenes content drives 46% more comments than standard promotional videos.
Mobile viewers are 2.8x more likely to engage with videos that start with a question or hook in the first 3 seconds.
Entertainment-focused mobile videos receive 53% higher share rates than educational content.
Live video sessions on mobile have an average watch time of 7 minutes and 20 seconds, while pre-recorded videos average just 4 minutes and 10 seconds.
Testimonial-style videos result in 35% higher engagement than scripted product explainers.
Mobile videos that include captions generate 27% more reactions than videos without any text overlays.
Interactive content (polls, quizzes, tap-to-choose) yields a 72% engagement rate, while static content averages 45%.
.webp)
Comedy videos lead mobile video categories in likes, with 68% of users saying they're the most likely type of content they’ll react to.
Device & Technical Performance
Videos optimized for mobile-first resolution (720x1280) load 38% faster and have a 22% lower bounce rate than non-optimized formats.

Viewers on 5G networks experience 56% higher video quality satisfaction than those on 4G or LTE.
Mobile videos that buffer for more than 3 seconds see a 47% drop in viewer retention.
On average, Android users watch 11% longer per video session than iOS users.
Videos auto-playing with muted sound have a 19% higher completion rate than those requiring manual play.

Viewers using smartphones with screen sizes above 6.2 inches are 33% more likely to finish videos compared to those with smaller devices.
Battery-saving modes reduce average watch time by 28%, due to decreased screen brightness and playback smoothness.
Tablets generate 2.1x more engagement on long-form mobile videos than smartphones.
Videos encoded with adaptive bitrate streaming reduce buffering rates by 42% compared to fixed bitrate videos.
Mobile videos viewed in full-screen mode receive 36% more interactions than those watched in embedded or minimized view.
Consumer Purchase Behavior
61% of mobile users say watching a product video directly influenced them to complete a purchase within the same day.
Product pages with embedded mobile video see a 34% higher conversion rate than those with static images only.
Users are 3.2x more likely to buy a product after watching a tutorial-style video compared to a standard ad.
Mobile shoppers who view unboxing videos are 45% more likely to add the item to their cart than those who read a review.
57% of consumers say they trust video testimonials more than written ones when deciding to buy a product on mobile.
Comparison videos increase purchase intent by 42%, while single-brand showcase videos increase it by just 21%.
36% of users make impulse purchases on mobile after watching influencer-led product videos, compared to 17% from brand-produced content.

68% of viewers say video demonstrations help them feel more confident about a product’s quality before buying.
Mobile ads with direct product links generate 29% more purchases than those requiring navigation to a separate landing page.
Shoppable mobile videos lead to 2.4x more completed checkouts than non-clickable video content.
Brand Usage & Adoption
74% of brands now include mobile video in their core content strategy, up from 52% the year before.

Brands posting mobile videos at least 3 times per week see a 41% higher engagement rate than those posting once weekly.
61% of small businesses say mobile video has helped them grow brand awareness faster than any other content format.
Brands using vertical video formats experience a 33% lift in mobile engagement compared to those sticking with landscape videos.
58% of marketers say mobile video ads have delivered stronger ROI for brand campaigns than display ads.
Influencer-partnered mobile videos result in a 2.6x increase in brand recall versus non-sponsored brand content.
49% of brands say that adding subtitles to their mobile videos significantly improved viewer retention.
Companies that regularly post behind-the-scenes mobile videos report a 37% increase in follower loyalty compared to brands that don’t.

42% of ecommerce brands say product-focused mobile videos drive more first-time customer conversions than email marketing.
Brands that integrate mobile video across at least 3 platforms report 2.3x more consistent audience growth than those posting on a single channel.
Current Trends & Projections
61% of brands have already started integrating vertical-first mobile video templates across multiple platforms.
Mobile video content featuring interactive elements (like polls or swipe actions) has grown by 46% in just the last 12 months.

39% of creators now produce content for at least 4 different platforms, showing a shift toward a multi-platform video strategy.
AI-generated subtitles are now used in 52% of mobile video campaigns, up from 34% six months ago.
.webp)
Among marketers focused on mobile, 44% say they are experimenting with short-form series or episodic content.
The use of dynamic video thumbnails (auto-play previews, hover effects) on mobile increased by 29% in the past year.
Shoppable mobile videos are currently used by 27% of ecommerce brands, with usage rising month over month.
62% of video editors working in mobile-first workflows report actively using automation tools to speed up post-production.
48% of brand managers say they have moved budget away from traditional video ads in favor of mobile-first content formats.
Mobile video projects that incorporate both user-generated and brand-produced content have increased by 36% this year alone.
Conclusion
Statistics show that brands must keep pace with consumer habits to succeed online. Mobile isn't just important anymore; it's essential.
Businesses that carefully adapt their video strategies to meet viewers on their phones will have a significant advantage, capturing more attention, engagement, and loyalty. Understanding details like the best video length, vertical versus horizontal formats, and what captures mobile users' attention can set marketers apart from competitors.
This information offers practical insights that brands can immediately apply, allowing them to produce mobile video content that resonates deeply with their audience. Staying informed and responsive to these trends isn't just beneficial; it's necessary for growth.
-p-130x130q80.jpeg)
A seasoned entrepreneur and AI enthusiast, Michael frequently shares insights on the intersection of technology and marketing. His writing focuses on leveraging artificial intelligence to enhance marketing strategies.
Create videos 10x faster and easier with Zebracat
Try it now
Comments