

Table Of Content


Video content has become a key part of how people engage on LinkedIn, and its role is only growing going into 2025. From quick updates and behind-the-scenes looks to product demos and thought leadership clips, video stands out in a feed that's often heavy on text and static images.
For marketers, recruiters, job seekers, and business leaders, understanding how video performs on LinkedIn goes beyond curiosity; it’s handy. It can help you adjust your strategy, improve visibility, and create stronger connections across the platform.
This collection of over 80 statistics highlights how video is being used today, which formats are drawing the most engagement, and what trends are starting to take hold. It covers everything from viewer behavior to content strategy, offering a clear snapshot of where things stand and where they’re headed.
If you’re looking to sharpen your LinkedIn presence or use video more effectively, these insights can help guide your approach.
Video Performance Metrics
Videos with a 70%+ completion rate are 3.5x more likely to be recommended by algorithms.

A strong hook in the first 3 seconds increases average retention by 23%.
Viewers decide whether to keep watching within the first 8 seconds.
Videos under 60 seconds retain 87% of viewers on average.
Thumbnails that include a human face improve click-through rates by 28% on average.
Videos with captions retain viewers 32% longer compared to non-captioned videos.
Live videos generate 4.6x more comments per viewer than pre-recorded uploads.
Only 3.4% of viewers subscribe immediately after watching a video, but they account for 24% of total channel growth.

1 in 5 videos is responsible for 80% of new subscribers gained in a 30-day period.
A/B tested titles result in a 17% average increase in click-through rate over non-tested titles.
Weekly video uploads increase overall engagement by 23% compared to irregular posting.
Videos optimized for silent viewing (text overlays, subtitles) see a 21% boost in engagement.
The ideal title length for maximum clicks is 47 characters.
Vertical videos receive 58% more engagement on mobile compared to landscape formats.

Videos that ask a direct question within the first 10 seconds have a 19% higher comment rate.
Videos with end-screen CTAs are 2.2x more likely to drive another video view.
Videos that include a mid-roll value teaser retain 11% more viewers through the halfway point.
60% of LinkedIn video views come from mobile devices.
Split-screen comparisons and before/after visuals lead to a 31% boost in average watch time.
The average click-through rate for suggested videos is 5.2%, while homepage CTR is 3.6%.
Videos with a high-performing hook receive an average of 6.7 interactions per 100 views.
Inconsistent posting schedules reduce average watch time by 18% over time.
Each additional tag improves discoverability by 3%, up to 10 tags.
Comment interaction correlates with a 14% increase in suggested video placement.
81% of total watch time comes from less than 20% of a creator's videos.
81% of videos that surpass 1 million views receive over 60% of their total views within the first 72 hours.
The average view duration on videos under 2 minutes is 83% from start to finish.
Engagement Metrics
Videos that receive engagement in the first hour are 4.1x more likely to be promoted by the algorithm.

Posts with video generate 3.2x more reactions compared to image-only posts on LinkedIn.
Videos with direct CTAs in the final 10 seconds get 27% more likes and comments.
Asking a question in the caption increases comment volume by 33%.
The average comment length on video posts is 42% longer than on text posts.
Engagement rates peak when videos are published between 9 AM and 11 AM local time.

Videos that mention the audience (“you,” “your,” etc.) in the first 15 seconds see a 22% lift in engagement.
The first 100 views generate nearly 60% of all initial likes and comments.
Pinned comments from the creator increase engagement by 19% on average.
Video posts with a custom thumbnail drive 24% more engagement than those using auto-generated frames.
Posts that include emojis in the video caption see 14% higher engagement rates.
Tagging another creator or company in the post increases comment rates by 26%.
Using LinkedIn’s native video upload (instead of external links) boosts engagement by 38%.
Posts under 150 words paired with a video generate 2.6x more reactions than longer captions.
Responding to comments within the first hour increases the total comment count by 34%.
Video posts with three or more hashtags perform 18% better in engagement than those with none.
The average engagement rate for video posts is 5.1%, compared to 2.8% for non-video posts.

Videos posted as part of a series receive 31% more recurring engagement per post.
Short-form videos (under 60 seconds) get 1.7x more engagement per second than longer videos.
Live videos see a 44% increase in real-time comments compared to pre-recorded content.
Including a poll in the same post as a video boosts interaction by 21%.
Videos that feature behind-the-scenes content outperform polished promotional videos by 15% in engagement.
Including a reaction prompt (e.g., “Agree?” or “Thoughts?”) raises interaction by 13%.
Engagement is 29% higher on videos with subtitles, especially when autoplay is enabled.
Posts that combine storytelling with a clear takeaway see a 16% uplift in total interactions.
Audience Demographics
The 25–34 age group accounts for 41% of all LinkedIn video views.

53% of video engagement comes from users in manager-level or senior roles.
Users with job titles including “Director,” “VP,” or “C-Suite” represent 29% of total video viewers.
Professionals in the marketing, sales, and tech sectors account for 47% of all video interactions.

Viewers employed at companies with 1,000+ employees contribute to 38% of total video views.
62% of LinkedIn video viewers are based in urban business hubs across North America and Europe.
India, the United States, and the United Kingdom together make up 55% of LinkedIn video traffic.
Viewers in the technology sector are 2.3x more likely to engage with video compared to those in education or non-profit.
Small business employees (companies with under 50 staff) represent 18% of LinkedIn video engagement.
24% of video viewers hold specialist or mid-level job titles like “Analyst,” “Coordinator,” or “Consultant.”
Professionals working in B2B companies make up 61% of the video-viewing audience.
67% of all video interactions come from users with 5+ years of work experience.
Viewers in the finance and legal sectors are 31% more likely to comment on video posts.
Company decision-makers (director level and above) contribute to 46% of total video likes and shares.
31% of video views come from the top 10 metropolitan cities globally.
Users based in New York, London, and Bangalore drive 26% of global LinkedIn video engagement.
Employees from mid-sized companies (51–500 employees) account for 34% of video interactions.
Creative professionals (designers, content strategists, UX) make up 12% of the video audience.
HR and talent professionals are 19% more likely to share video content than users in other roles.
Remote workers engage with video content 28% more frequently than those in traditional office settings.
9 out of 10 viewers who engage with LinkedIn videos are also active in commenting or sharing posts monthly.

Viewers in client-facing roles (sales, customer success) contribute to 45% of video replies and mentions.
73% of all video engagement comes from users who access LinkedIn via mobile.
Users in enterprise roles (strategic partnerships, product owners, business leads) drive 33% of long-form video engagement.
The healthcare and education sectors together account for just 6% of total LinkedIn video activity.
Traffic Sources
67% of video views on LinkedIn originate from the main feed via organic reach.
Video posts shared via private messages result in a 21% higher completion rate compared to public shares, which average a 38% completion rate.

42% of viewers who engage with a video go on to view the creator’s profile within 24 hours.
Hashtag feeds account for 18% of total video impressions on LinkedIn.
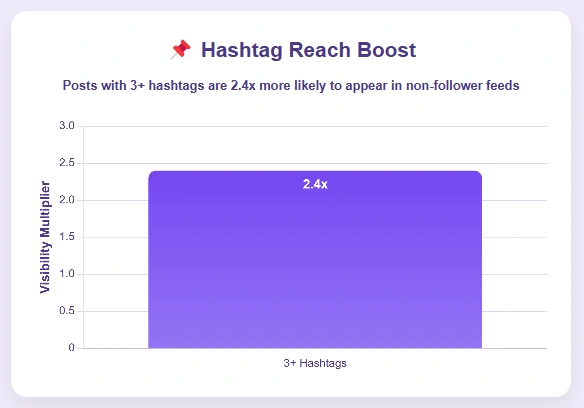
Posts with 3 or more hashtags are 2.4x more likely to appear in non-follower feeds.
31% of LinkedIn video traffic comes from followers who discover content without prior engagement.
Videos that appear on company pages receive 36% of their traffic from internal employee shares.
External shares (email, WhatsApp, Slack) contribute to 12% of total video viewership.
Viewers arriving through profile views are 1.8x more likely to watch a video to completion.
Trending hashtag pages drive 9% of viral video spikes on LinkedIn.
Posts that get re-shared within the first hour see a 27% increase in total reach.
Content discovered via mutual connections generates 3.3x more engagement than content viewed by strangers, who average an engagement rate of 1.2%.

15% of views on LinkedIn videos come from users who never followed the creator but clicked from another user’s activity.
Videos mentioned in group messages or shared team chats see a 19% rise in watch-through rate.
Profile-driven video views account for 24% of creator subscriber growth on LinkedIn.
4 out of 10 video viewers return to a creator’s profile within 48 hours of discovering a video.
Users who watch videos through hashtag feeds are 31% more likely to comment than those from the main feed.
Videos embedded in LinkedIn newsletters contribute to 5.6% of total traffic.
Reactions from high-profile users result in a 44% bump in impressions within the next hour.
62% of first-time viewers discover LinkedIn videos through passive feed scrolling, not search or tags.
Videos sent through in-app DMs are 2.1x more likely to be re-shared.
A single share in a LinkedIn group leads to a 17% increase in post visibility.
Users who come to a video via someone's comment are 23% more likely to engage themselves.
Profile visits triggered by video views result in 14% higher connection rates.
11% of views come from mobile users tapping videos through notification previews.
Device & Platform Insights
73% of all LinkedIn video views occur on mobile devices.
Videos viewed on mobile have a 19% higher completion rate than those viewed on desktop.

68% of engagement actions (likes, comments, shares) happen on mobile.
Desktop viewers spend an average of 17% more time watching long-form videos.
Videos with square or vertical formats perform 2.1x better on mobile feeds.
Users on the LinkedIn mobile app are 2.4x more likely to tap into autoplay videos.
81% of autoplay starts happen on smartphones, mostly via scrolling in the main feed.
Videos accessed through the desktop platform are 25% more likely to be paused or replayed.
Notifications on mobile trigger 38% of video re-views within the same day.
Tablet users make up 6% of all video views but account for 13% of total watch time.

Videos under 60 seconds perform 34% better on mobile compared to desktop.
Creators using LinkedIn’s mobile publishing tools post 29% more video content than desktop-only users.
Mobile users are 1.9x more likely to react to videos immediately after watching.
Desktop viewers are 22% more likely to click through to external links after viewing a video.
The LinkedIn app’s video player loads 42% faster on iOS than on Android.
Viewers watching via desktop are 17% more likely to watch with sound on.
14% of all mobile video views come from users switching between work and personal accounts.
88% of mobile video impressions occur during non-working hours (early morning, lunch, or evening scrolls).
Desktop users initiate 21% more comment threads than mobile viewers.
Mobile users scroll past videos 2.7x faster unless subtitles or captions are present.
The average video file size for mobile-optimized posts is 27% smaller than standard desktop uploads.
Autoplay videos on desktops are 31% less likely to be expanded to full screen.
Mobile app users are responsible for 3 out of every 5 replays within the first 24 hours.

Creators who check analytics via the LinkedIn mobile app are 46% more likely to adjust posting times based on performance.
11% of desktop video engagement originates from users accessing LinkedIn via workplace intranet browsers.
Posting Insights
Posting between Tuesday and Thursday, from 9 AM to 11 AM, leads to the highest engagement rates for video content.

Creators who post consistently once per week experience 3.4x more total engagement than those who post irregularly.
Videos posted within 30 minutes of previous audience activity (likes, comments, or views) see a 22% increase in reach compared to posts made outside that window, which typically reach only 61% of the engaged audience.

Posts published 3–5 times per week maintain a 46% higher average retention rate across videos.
Posts with a teaser or hook in the caption generate 2.7x more watch time.
Using the word “video” in the first line of a post increases view rates by 18%.
Uploading directly to LinkedIn rather than linking from outside boosts post visibility by 42%.
Videos scheduled through LinkedIn's native tool perform 17% better than those posted manually.
Creators who batch film and post on a regular calendar see 31% more interaction per video.
Caption length of 30–60 words results in 23% higher engagement on average.

Including a clear call-to-action in the last 10 seconds increases profile visits by 27%.
Avoiding outbound links in the main post body improves native video reach by 38%.
The first 90 minutes after posting account for nearly 60% of total reach.
Posts that receive 5+ comments within the first hour are 3.1x more likely to trend.
Videos posted with an engaging thumbnail and title combo get 2.5x more click-throughs.
Sharing videos at the same time each week helps build 25% stronger engagement momentum.
Weekend video posts perform 36% worse on average compared to weekday uploads.
Videos under 2 minutes posted mid-week outperform longer videos posted on Mondays by 41%.
Posts containing open-ended questions in the caption get 29% more replies.
Posts with custom thumbnails are 19% more likely to be re-shared.
Posts that include a soft CTA (like “Thoughts?” or “Curious what others think”) see a 14% boost in interaction.
Posts edited within the first 10 minutes of publishing are 2.2x more likely to drop in reach.
Videos posted during holidays or long weekends show a 33% dip in performance.
Posts that tag 2–3 relevant people perform 21% better than posts with no tags or excessive tagging.
Reposting the same video within 30 days results in 52% lower engagement the second time.
Conclusion
LinkedIn’s focus on video isn’t just a feature update. It’s becoming a regular part of how people share ideas, tell their stories, and stay visible in their professional circles.
The data above shows a clear trend: when used well, video grabs attention, drives more engagement, and helps build stronger connections.
Whether you’re offering insights, sharing team moments, or simply showing up more often in your feed, video gives you a more relatable and effective way to reach others. As 2025 continues to progress, there’s a real opportunity to use video with purpose; whether that’s growing your business, supporting your brand, or building trust in your field.
These statistics are meant to help you get started or improve what you're already doing. Use them to guide your content, test new ideas, and connect with your audience in ways that feel authentic and lasting.
-p-130x130q80.png)
Hey there, I’m Jenny. I’ve been in marketing for almost 10 years, and I love marketing tech, AI, and automation. I’ve built several YouTube and TikTok channels—some hits, some misses. I joined Zebracat after being a user myself, ready to share my learnings with the world!
Create videos 10x faster and easier with Zebracat
Try it now
.png)


-p-130x130q80.jpeg)
Comments